User Guide
User journey overview
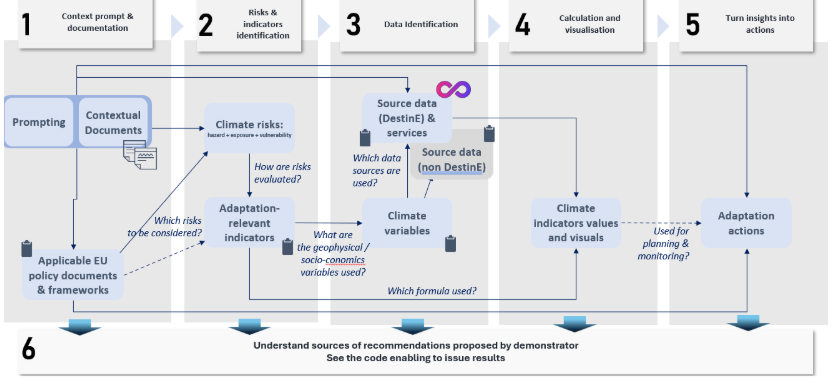
The Climate Adaptation Insights demonstrator guides you through a structured journey to identify the indicators that are relevant for monitoring climate change adaptation.
This image below gives you an overview of how the demonstrator works.
Using the demonstrator
This section covers the core features of Climate Adaptation Insights: reference documents, AI chatbot, risks-indicators mapping, datasets identification and indicators calculation.
Reference documents
The demonstrator has its own list of documents that aims to represent the diversity of climate project in a region: transport, cities, private companies, energy…
This list is not definitive and is only there to help the user to start his/her journey. To support the analysis, the user can give more details on how the adaptation should be done or what are the most important risks for instance.
AI chatbot
The chatbot role is to gather all the additional information the user wants to add in order to have a personalised experience.
The chatbot can receive some requests from the user: add/remove a risk that is not relevant, redefine the spatial extent, etc.
Risks-indicators mapping
This feature directly helps the demonstrator to retrieve all the indicators that are the most accurate for the context of the document and the user. It first identifies all the risks mentioned in the document. Then, it associates one or several indicators that monitor the climate change adaptation.
Datasets identification
In a dedicated section, the demonstrator lists for each indicator all the DestinE datasets that could be used for the calculation. The user cannot change anything, and it is only informative for displaying all the sources that are requested for the calculation.
Indicators calculation
The selected indicators results are displayed, and the user can interact with each of them. There is a first view with an average value of the indicator over the period. Then, the user can select the map view where the period can be selected.